Executive Summary
On April 7, 2025, the Hang Seng Index experienced a dramatic 13.22% drop, falling more than 3,000 points to close at 19,828.30. This represents the steepest single-day decline since the 1997 Asian financial crisis.
Key Finding: Trade War Impact
The primary cause of the market crash was the escalation of trade tensions between the United States and China, with US President Donald Trump announcing sweeping tariffs and China retaliating with a 34% tariff on US imports.
Key Finding: Sector Performance
Companies with significant exposure to international trade, particularly in the Technology and Healthcare sectors, were most severely impacted, while domestic-focused Utilities companies demonstrated remarkable resilience.
Market Context and Causes
The Trade War Escalation
The market crash was triggered by a "double whammy" of trade actions:
- US Tariff Announcement: President Trump unveiled sweeping tariffs on almost all countries, with a baseline tariff of 10% on imports and steeper duties of 11-50% set to go into effect shortly after.
- China's Retaliation: China announced a 34% tariff on US imports, representing an unprecedented escalation compared to previous trade tensions.
- Timing Factors: Friday (April 4) was a public holiday in Hong Kong, so Monday's trading reflected accumulated reactions to both announcements.
Economic Impact Estimates
According to economic analysts:
- Trump's levies are estimated to lift the US effective tariff rate by 17.6 percentage points to 25.3%
- This translates to around a 2% increase in US prices and will hit US growth by 0.9%
- China and Vietnam are expected to experience losses exceeding 0.5% of GDP
- European Union and Japan face a hit of around 0.3% to 0.4% of GDP
Global Market Context
The Hang Seng Index drop occurred within a broader global market selloff:
- US stocks have shed more than $6 trillion in value since Trump's "Liberation Day" announcement
- Markets in mainland China, Japan, South Korea, Taiwan, Australia, and Singapore all suffered steep declines
- The Hang Seng Tech index plunged even more dramatically, falling 17.16% to 4,401.51
Sector Performance Analysis
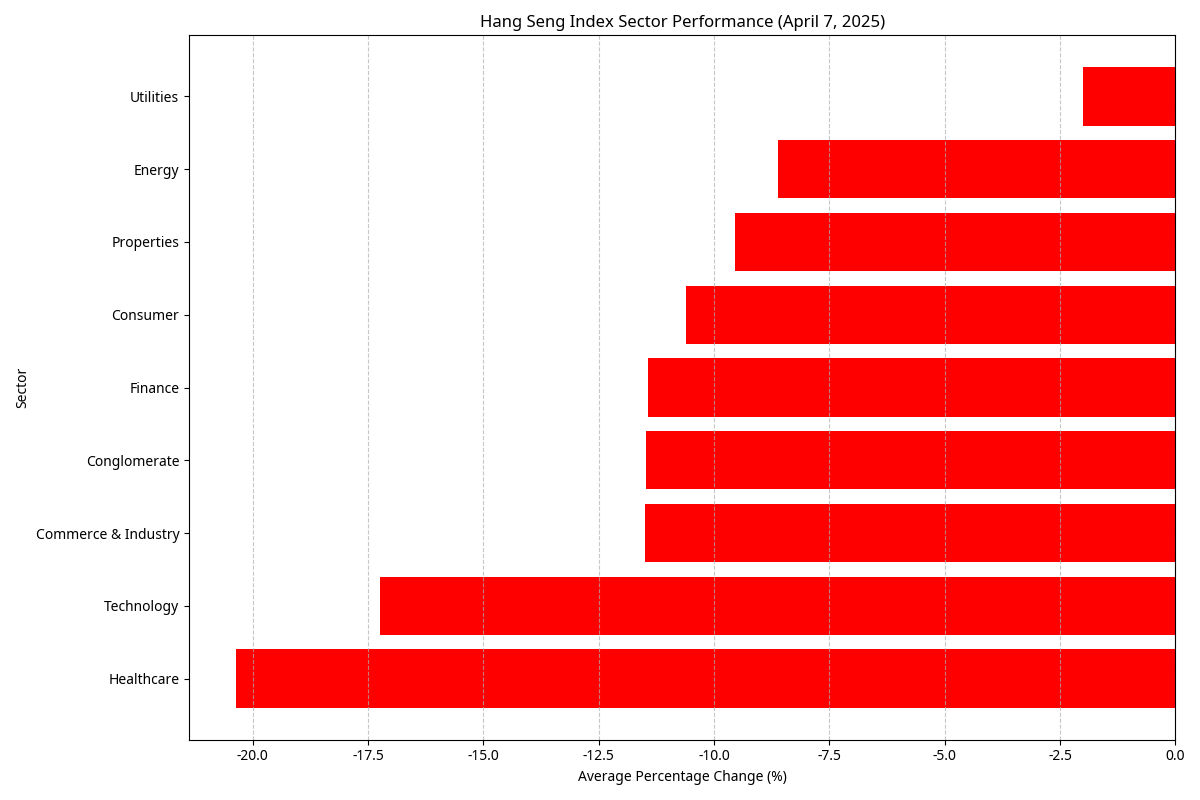
Sector Average Declines
From least to most affected:
- Utilities: -2.01%
- Properties: -9.54%
- Energy: -8.62% (single stock)
- Consumer: -10.61%
- Finance: -11.43%
- Conglomerate: -11.47%
- Commerce & Industry: -11.49%
- Technology: -17.25%
- Healthcare: -20.37%
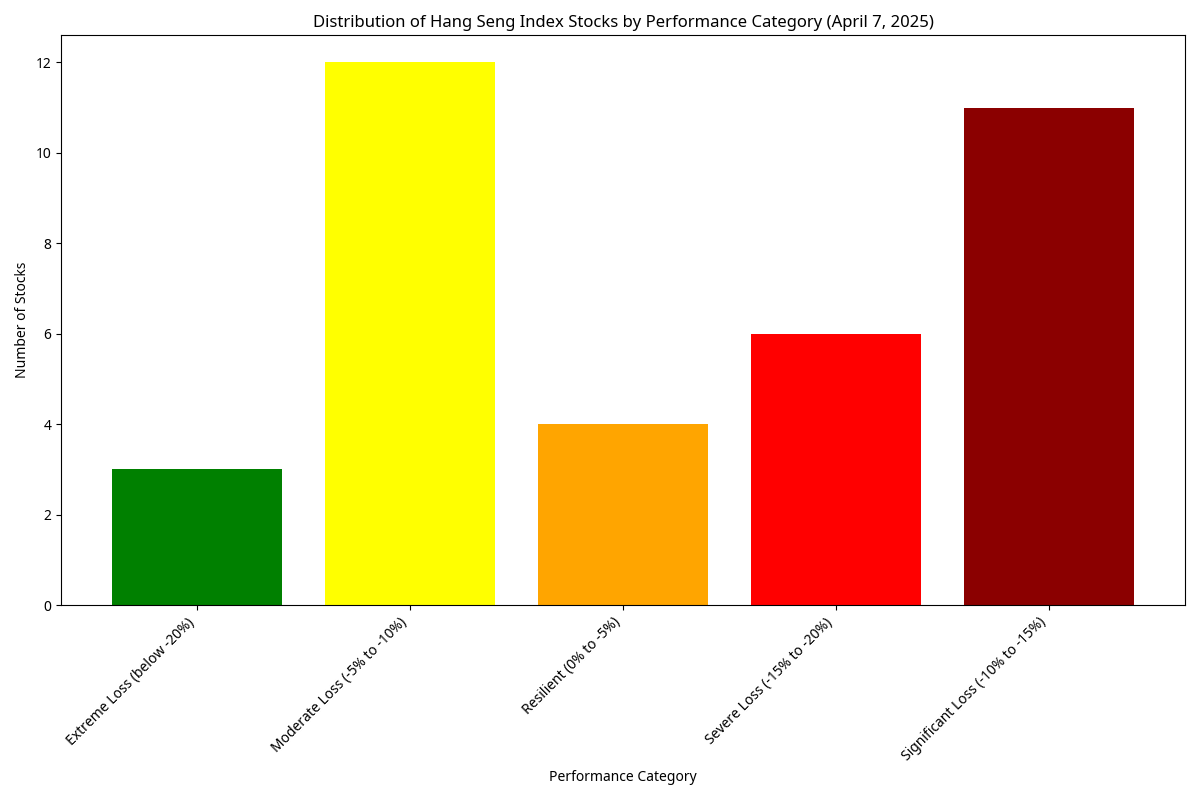
Performance Categories Distribution
We categorized stocks based on their percentage decline:
- Resilient (0% to -5%): 4 stocks (11.1%)
- Moderate Loss (-5% to -10%): 12 stocks (33.3%)
- Significant Loss (-10% to -15%): 11 stocks (30.6%)
- Severe Loss (-15% to -20%): 6 stocks (16.7%)
- Extreme Loss (below -20%): 3 stocks (8.3%)
Sector Performance Visualization
Performance Categories Distribution
Sector vs Performance Category Heatmap
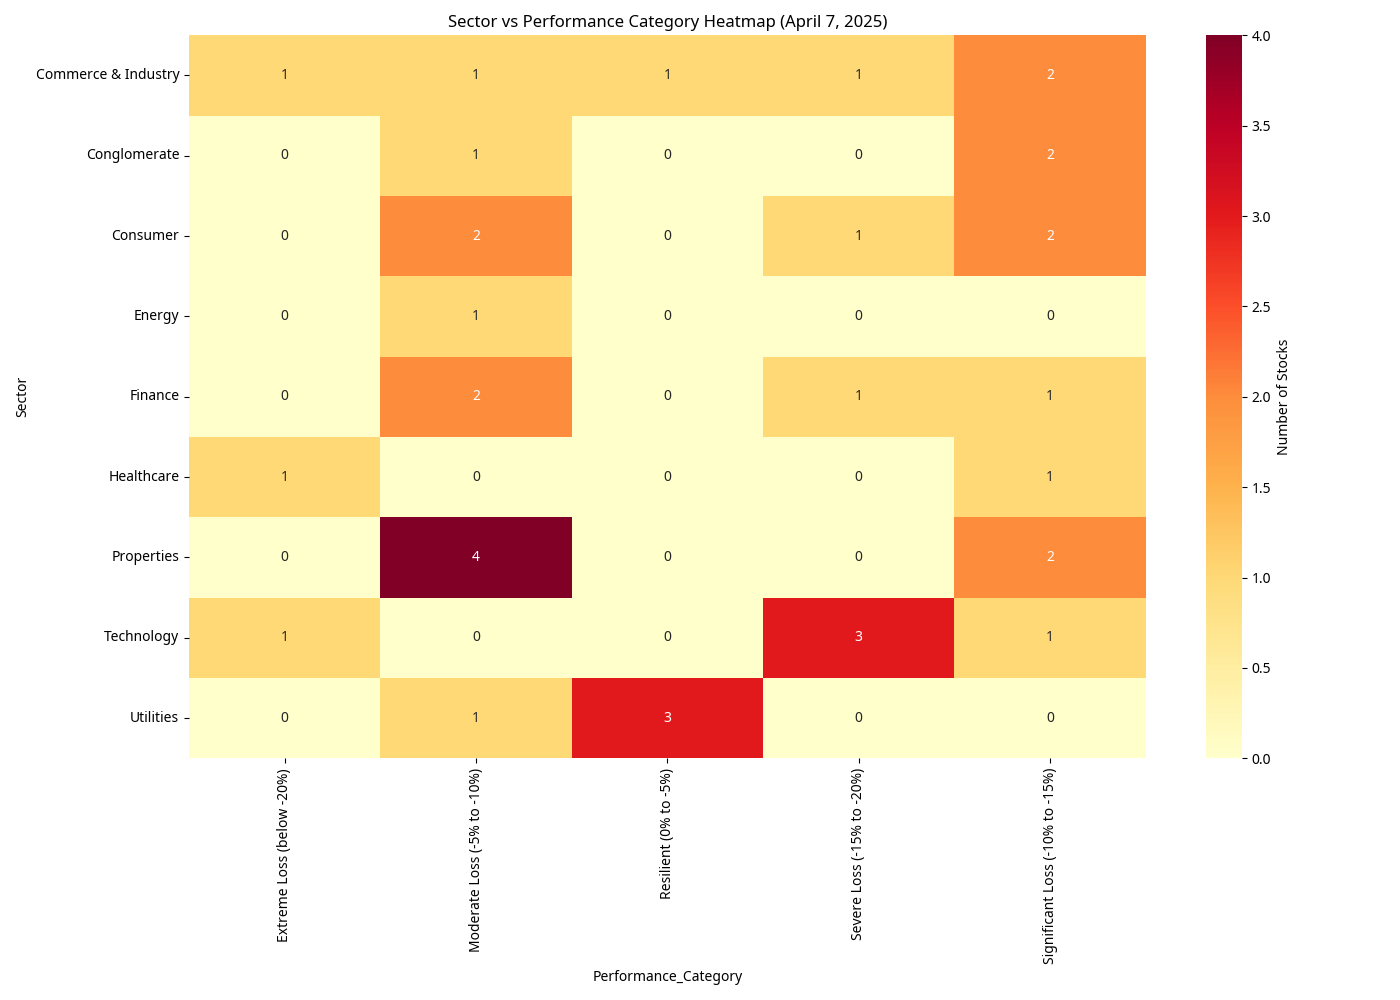
Key Patterns and Correlations
1. Sector-Based Performance Patterns
The sector performance heatmap reveals clear patterns in how different sectors were affected:
- Utilities Sector Resilience: 3 out of 4 Utilities stocks were in the "Resilient" category
- Properties Sector Concentration: 4 out of 6 Properties stocks had "Moderate Losses"
- Technology Sector Vulnerability: 3 out of 5 Technology stocks suffered "Severe Losses"
- Healthcare Sector Devastation: Healthcare stocks experienced the most extreme losses
2. Business Model and Trade Exposure Correlations
A strong correlation exists between a company's business model, its exposure to international trade, and its stock performance during the crash:
Companies providing essential domestic services were least affected
These businesses have limited direct exposure to international trade disruptions
Companies with significant US market exposure or reliance on US technology suffered most
Technology giants like Alibaba (-17.98%), Xiaomi (-20.59%), and JD.com (-15.51%) were severely impacted
Healthcare companies with international operations were heavily affected
WuXi Biologics (-26.44%), which provides services to global pharmaceutical companies including US firms, was the most affected stock
3. Market Capitalization and Liquidity Patterns
Stocks with extremely high trading volumes generally experienced more severe declines, suggesting significant institutional selling and portfolio rebalancing:
- XIAOMI-W: 1.038B volume, -20.59% decline
- CNOOC: 517.012M volume, -15.29% decline
- LENOVO GROUP: 469.686M volume, -22.89% decline
4. Chinese vs. Hong Kong-Based Companies
- Mainland Chinese Companies with primary operations in mainland China were generally more affected
- Hong Kong-Based Traditional Companies in sectors like utilities and local transportation showed more resilience
Most Resilient vs. Most Affected Stocks
Most Resilient Stocks
| Symbol | Company | Sector | Change (%) |
|---|---|---|---|
| 0002.HK | CLP HOLDINGS | Utilities | -0.23 |
| 0006.HK | POWER ASSETS | Utilities | -0.62 |
| 1038.HK | CKI HOLDINGS | Utilities | -1.66 |
| 0066.HK | MTR CORPORATION | Commerce & Industry | -2.14 |
| 0003.HK | HK & CHINA GAS | Utilities | -5.51 |
Most Affected Stocks
| Symbol | Company | Sector | Change (%) |
|---|---|---|---|
| 2269.HK | WuXi Biologics | Healthcare | -26.44 |
| 0992.HK | LENOVO GROUP | Commerce & Industry | -22.89 |
| 1810.HK | XIAOMI-W | Technology | -20.59 |
| 9988.HK | Alibaba Group | Technology | -17.98 |
| 2015.HK | Li Auto Inc. | Consumer | -17.85 |
Conclusion: Why Different Groups of Stocks Were Affected Differently
The performance patterns during this market crash strongly correlate with the US-China trade war escalation:
1. Direct Trade Impact
Companies with significant exports to or imports from the US were most vulnerable to the new tariffs.
2. Supply Chain Exposure
Companies dependent on complex global supply chains (especially technology manufacturers) were severely affected.
3. Domestic Focus as Protection
Companies focused on the domestic market with minimal international exposure showed greater resilience.
4. Essential Services Stability
Utilities and basic services maintained relative stability as their operations and revenue streams are less affected by international trade disputes.
5. Investor Risk Perception
The extreme reaction in technology and healthcare stocks reflects investor concerns about long-term impacts of trade barriers on innovation-dependent sectors.
This market event demonstrates how investors differentiated between companies based on their vulnerability to trade tensions, with domestic-focused essential services providers showing remarkable resilience compared to internationally exposed technology and healthcare companies.